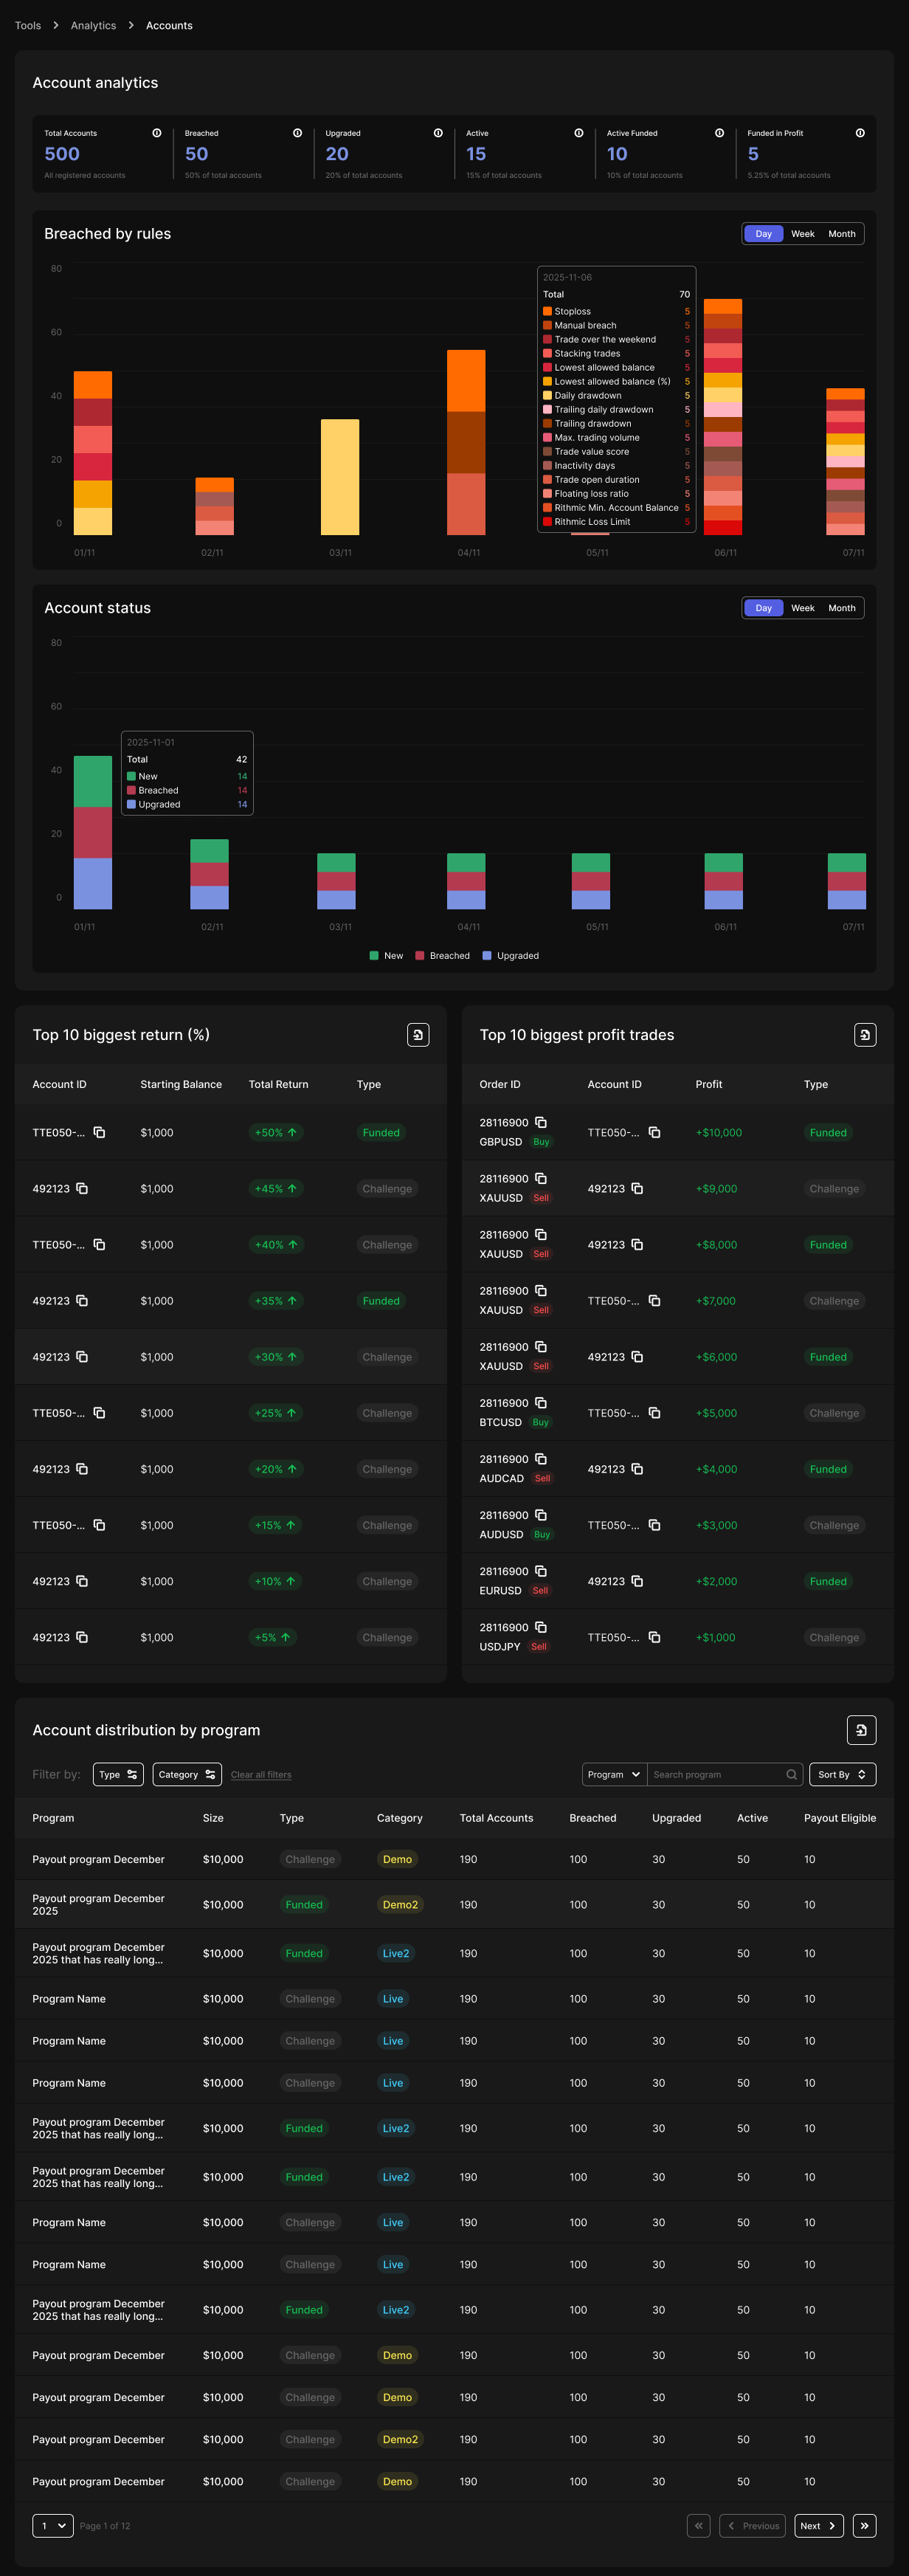
# Accounts Analytics
The **Accounts Analytics** page provides an at-a-glance and in-depth view of all accounts under a tenant.
It helps admins monitor account flow, detect issues in challenge progression, and analyze program-level performance across the platform.
## Top Metrics Overview
At the top of the page, admins can view six key lifetime metrics, giving a quick snapshot of overall account health:
* **Total Accounts** - The total number of accounts ever created under the tenant.
* **Breached Accounts** - Number of accounts that violated the rules.
* Formula: `Breached Percentage = (Number of Breached / Total) * 100`
* **Upgraded Accounts** - Number of accounts that successfully progressed to the next phase.
* Formula: `Upgraded Percentage = (Number of Upgraded / Total) * 100`
* **Active Accounts** - Number of currently active accounts.
* Includes accounts with statuses: `Active`, `Waiting Withdrawal`, and `Upgrade Pending`.
* Formula: `Active Percentage = (Number of Active / Total) * 100`
* **Active Funded Accounts** - Number of active accounts in the funded stage.
* Formula: `Active Funded Percentage = (Number of Active Funded / Total) * 100`
* **Active Funded in Profit** - Active funded accounts with a positive profit.
* Formula: `Active Funded in Profit Percentage = (Number of Active Funded in Profit / Total) * 100`
All values shown here are **lifetime metrics**, regardless of the filters applied elsewhere on the page.
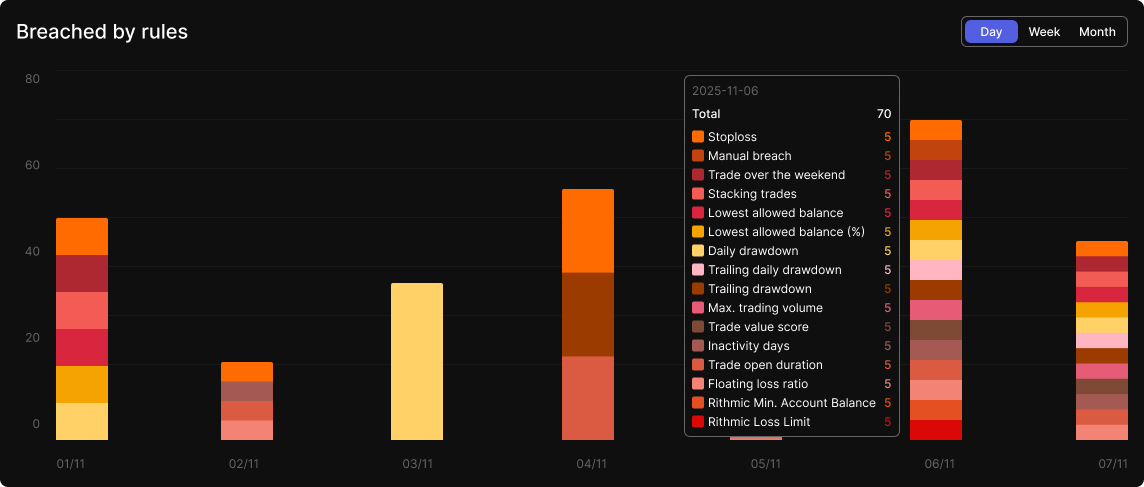
## Breaches Overview
This chart displays the number of **breached accounts** over the last 7 periods based on the selected filter:
* **Day**: Last 7 days
* **Week**: Last 7 weeks (each value is cumulative sum of daily data)
* **Month**: Last 7 months
Each breached entry is broken down by the **violation rule**. Backend records breaches using UTC 00:00 boundaries to ensure consistency.
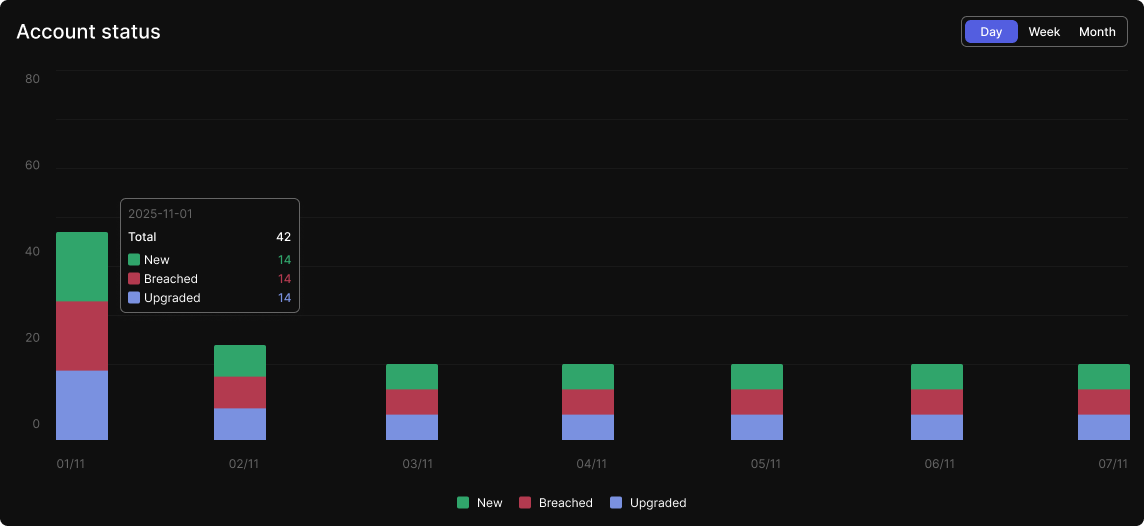
## Account Status Trends
A historical chart showing the flow of accounts over time, tracking:
* **New accounts**
* **Breached accounts**
* **Upgraded accounts**
Administrators can toggle between daily, weekly, and monthly views using the same filter as the breach chart.
## Top Performing Accounts
### Top 10 by Return %
Shows the top 10 **active accounts** with the highest return percentages. These accounts may be in either **Challenge** or **Funded** stages. Data is sorted in descending order of return %.
### Top 10 Most Profitable Trades
Highlights the most profitable trades from **active accounts** (Challenge or Funded). This helps identify trading strategies or patterns that result in high profits.
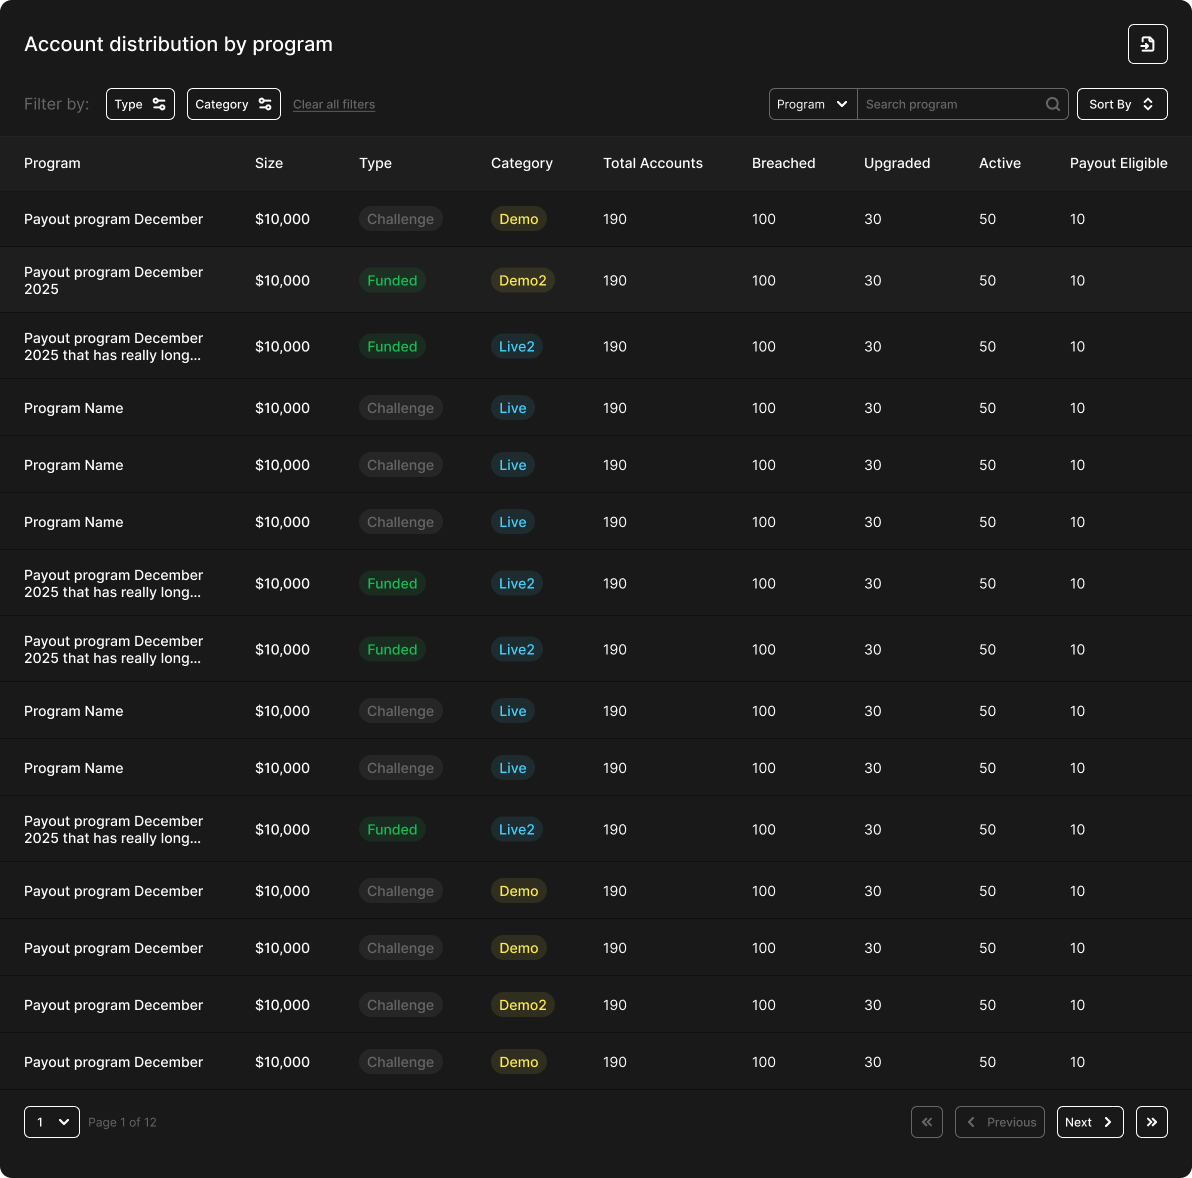
## Program Distribution Table
A searchable and sortable table that gives a program-level breakdown of account distribution.
**Table Columns**
* **Program Name**
* **Program Size** - Initial balance (e.g., $10,000)
* **Program Type** - Challenge or Funded
* **Program Category** - Demo / Demo2 / Live / Live2
* **Total Accounts** - Total number of accounts
* **Breached** - Total number of breached accounts
* **Upgraded** - Total number of upgraded accounts
* **Active** - Total number of active accounts
* **Payout Eligible** - Number of active funded accounts eligible for payout
* Note: For challenge programs, this value is always `0`.
**Filter Options**
* By **Type**
* By **Category**
**Searchable By**
* By **Program Name**
* By **Program Size**
**Sort Options**
Each column can be sorted by:
* Biggest / Smallest **Total Accounts**
* Biggest / Smallest **Breached**
* Biggest / Smallest **Upgraded**
* Biggest / Smallest **Active**
* Biggest / Smallest **Payout Eligible**